Self-employment in Quebec: how many and in which trades?

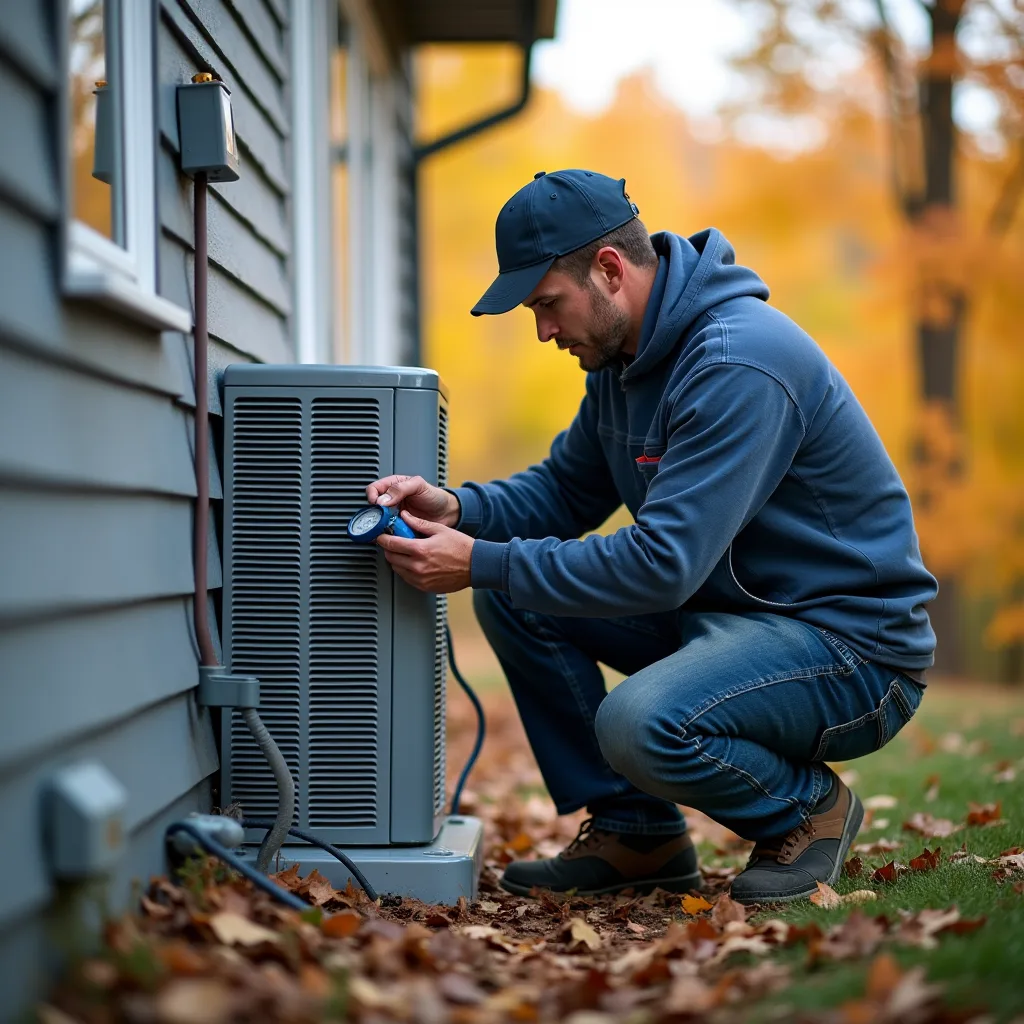
Tuesday, 7 a.m., on a quiet street: a landscaper's truck, a painter's van and a house cleaner's car park one behind the other. Three businesses, and often just one person behind each. How many people in Québec work for themselves like this? Statistics Canada has the answer, and it holds a few surprises.
A little over half a million people
According to Statistics Canada's Labour Force Survey, Québec had an average of 512,400 self-employed workers in 2025, out of 4,644,800 employed people. That's 11.0% of total employment, or about one employed person in nine.
Who's counted? Statistics Canada includes active owners of a business, incorporated or not, with or without employees, self-employed people who don't have a business as such, and a few unpaid family workers. The snow removal operator with their own tractor, the painter who bills her clients and the small landscaping contractor with three employees are all in the same number.
One detail matters: the breakdown by industry is based on the main job. An office clerk who does cleaning on her own on Saturdays isn't counted as self-employed if her main job is salaried.
How does that compare with the rest of the country? Québec is a bit below. In the same Statistics Canada table, the self-employed share reaches 12.9% of employment in Canada and 13.5% in Ontario in 2025, compared with 11.0% here. In other words, working for yourself is slightly less common in Québec than elsewhere, which doesn't stop some trades from being full of it.
One last reading trap: these figures are annual averages. A snow removal operator who only works from November to April weighs less in the average than a painter who works twelve months. Seasons matter, and seasonal self-employed workers are more numerous in winter or summer than a single annual number suggests.
Do it today: if you already work for yourself, even part-time, say so plainly in your professional profile. You're part of a group of half a million people, not an exception.
Alone in the truck: the most common picture
The cliché of the “boss” running a big crew doesn't hold up. The vast majority of self-employed Quebecers work with nobody on their payroll. Here's the 2025 breakdown:
| Type of self-employed worker (Québec, 2025) | Number | Share of self-employed |
|---|---|---|
| Unincorporated, no paid help | 264,500 | 51.6% |
| Incorporated, no paid help | 124,300 | 24.3% |
| Incorporated, with paid help | 99,600 | 19.4% |
| Unincorporated, with paid help | 22,000 | 4.3% |
The rest, about 2,000 people, are unpaid family workers. Do the math: 388,800 self-employed workers have no paid help, nearly 76% of the total. Three in four do everything themselves: quotes, the work, invoicing and washing the truck on Sunday night.
Another finding: more than half aren't incorporated. They run their business under their own name. To know where to start if you want to join them, read Becoming self-employed in Quebec: the steps from A to Z.
Do it today: if you work alone, list the tasks that aren't “real” work (quotes, invoices, calls). That's where you lose the most unpaid hours.
The sectors where self-employment counts most
Statistics Canada classifies workers by the industry of the business, not by their exact trade. It still gives a clear picture of where working for yourself is common. Here are the sectors closest to the service trades, in 2025:
| Sector (Québec, 2025) | Total employment | Self-employed | Share |
|---|---|---|---|
| Other services (repair and maintenance, personal services…) | 172,600 | 49,300 | 28.6% |
| Business, building and other support services | 159,500 | 37,700 | 23.6% |
| Transportation and warehousing | 223,600 | 34,500 | 15.4% |
| Construction | 323,500 | 46,300 | 14.3% |
| Health care and social assistance | 677,900 | 81,300 | 12.0% |
| All sectors | 4,644,800 | 512,400 | 11.0% |
“Other services” include repair and maintenance, as well as personal services such as hairdressing. “Building services” include, among others, building cleaning and landscaping. In both sectors, close to one person in four or more works for themselves. By comparison, the share drops to 4.8% in accommodation and food services.
The largest numbers are elsewhere: 85,500 self-employed in professional, scientific and technical services, and 81,300 in health care and social assistance. Agriculture keeps the highest proportion, 46.7%, among a small number of people.
Do it today: find your sector in the table. If it's above 20%, your competitors are mostly other self-employed people, not big companies: take care of your local reputation.
The trend: fewer than in 2019, but climbing back
The number of self-employed workers in Québec fell after 2019, then levelled off before rising again in 2025. Meanwhile, the number of employees kept climbing. The result: the self-employed share of total employment went down.
| Year | Self-employed workers | Share of total employment |
|---|---|---|
| 2015 | 541,700 | 13.4% |
| 2019 | 552,400 | 12.8% |
| 2020 | 527,500 | 12.9% |
| 2021 | 507,400 | 11.9% |
| 2022 | 499,200 | 11.4% |
| 2023 | 500,400 | 11.1% |
| 2024 | 499,700 | 10.9% |
| 2025 | 512,400 | 11.0% |
In the sectors closest to the service trades, the drop since 2019 is clear: from 50,400 to 46,300 self-employed in construction, from 56,400 to 49,300 in other services, and from 41,200 to 37,700 in business and building services. Health care and social assistance is the exception, from 77,500 to 81,300.
The most telling detail is in the categories. Self-employed people who work alone have barely moved. It's the ones with employees who have shrunk:
| Self-employed workers in Québec | 2019 | 2025 | Change |
|---|---|---|---|
| No paid help (incorporated or not) | 386,200 | 388,800 | +2,600 |
| With paid help (incorporated or not) | 162,900 | 121,600 | −41,300 |
In construction, self-employed workers with employees went from 22,800 to 18,900, while solo operators held steady at around 27,300. In other services (repair, personal services), those with employees went from 12,400 to 8,000. If you run a small crew, you belong to a group that's getting smaller.
Why? The numbers don't say. Statistics Canada measures how many, not why, and we won't make up an explanation. What we can say: in 2025, Québec still had 12,700 more self-employed workers than in 2024.
Do it today: look at your own sector in the paragraph above. Fewer self-employed workers can mean less competition for those who remain. And if you have employees, say so in your quotes: a crew that can take on a big contract is getting rarer.
Who they are: men, women and age
In 2025, Québec had 302,400 self-employed men and 210,000 self-employed women, according to Statistics Canada. Women therefore make up about 41% of the group. Measured another way: 12.4% of employed men work for themselves, compared with 9.5% of employed women. And almost all of the drop since 2019 comes from men, who went from 339,600 to 302,400, while women stayed close to 210,000.
The picture varies a lot from one sector to another. In construction, men clearly dominate (42,800 out of 46,300), even though the number of self-employed women there rose from 1,900 to 3,400 since 2019. In health care and social assistance, it's the reverse: 60,300 women out of 81,300 self-employed. The Institut de la statistique du Québec adds a detail: in 2024, women made up about 24% of self-employed workers with paid help, but about 43% of those working without employees.
Age matters even more. According to the Institut, in 2025, barely 2.1% of 15- to 24-year-olds and 7.4% of 25- to 34-year-olds were self-employed, and the share has been trending down among young people since 2000. At the other end, in 2023, 31% of employed men and 21% of employed women aged 65 and over worked for themselves. In Québec, self-employment is often a second career, after years as an employee in the trade.
Be careful with comparisons: the Institut builds its estimates from the microdata of the same survey, but with a slightly broader definition (it includes, for example, people who were self-employed in the last 12 months and are now looking for work). Its numbers therefore don't add up exactly to Statistics Canada's.
Do it today: if you're under 35 and thinking of going out on your own, find an experienced self-employed worker in your trade and offer to help during their busy season. You'll learn the business side, not just the technical side.
What these numbers mean for you
Thinking of going out on your own? You wouldn't be alone: one worker in nine has done it. But three in four self-employed people have no employees, which means everything rests on you, including when you're sick or on vacation. Plan for it from the start in your pricing and your schedule.
Are you an employer? In building cleaning, landscaping or repair, a good share of the available workforce works for itself. Using a subcontractor is a real option, as long as you clearly tell a genuine self-employed worker from a disguised employee. The criteria are explained in Employee or self-employed? The criteria that matter in Quebec.
Looking for work this winter? Self-employed workers aren't just competitors: they're also potential clients, who sometimes need a hand during busy periods. To find out where the work is this season, read the main article in this section, Winter jobs in Quebec: the trades hiring from November to March.
Careful: self-employed in the statistics doesn't mean self-employed in the eyes of the law. Statistics Canada counts what people report. Revenu Québec looks at the reality of the working relationship: effective subordination first, then the economic or financial criterion, ownership of tools, integration of the work, the specific result of the work and the attitude of the parties. Status can change if the conditions change. If the payer and the worker disagree, a request for a decision can be made with form RR-65.
Another simple rule if you're starting out: a person who runs a sole proprietorship under a name that doesn't include their own last name and first name must register with the Registraire des entreprises within 60 days of starting operations. “Déneigement Tremblay” without a first name, or “Les Pros du pinceau,” means registration. All the details are in Registering with the Quebec enterprise registrar: when it is required.
Do it today: pick the bold sentence that sounds like you and take the first step it suggests before the end of the week.
Self-employed workers on GPP Emploi
On GPP Emploi, self-employed workers are welcome. You turn on “Contracts on my own” in your profile, then answer requests for quotes with your price. The contract is signed on the platform and you deliver in stages; after each stage, the client has 72 hours to accept or dispute it, otherwise it's accepted automatically.
You can also open a public showcase, with your photos and reviews, and get your own clients through GPP Central, with the same account. The 5% matching fee on the contract amount is paid by the client, in credits, at signing. Everything is explained on the self-employed page.
On the employer side, the “request for quotes” is designed precisely for handing a result to deliver to a self-employed worker who sets their own price, rather than hiring an employee whose schedule you supervise.
Do it today: open the requests for quotes page and filter by your trade. You'll see right away whether your sector is moving near you.
The bottom line
In Québec, a little over half a million people work for themselves, and three in four do it without employees. If you join them, organize yourself like a one-person business from day one: that's exactly what you'll be.
Frequently asked questions
How many self-employed workers are there in Quebec?
According to Statistics Canada's Labour Force Survey, Québec had an average of 512,400 self-employed workers in 2025. That's 11.0% of the 4,644,800 employed people.
What share of self-employed workers have employees?
In 2025, about 76% of self-employed workers in Québec had no paid help, or 388,800 people. More than half ran an unincorporated business with no employees.
Which sectors have the most self-employed workers in Quebec?
By proportion, agriculture leads (46.7% in 2025), followed by other services such as repair and personal services (28.6%) and business and building services (23.6%). By number, professional, scientific and technical services and health care each exceed 80,000 self-employed workers.
Is self-employment growing in Quebec?
It fell from 552,400 in 2019 to 499,200 in 2022, then climbed back to 512,400 in 2025. Because the number of employees grew faster, the self-employed share went from 12.8% to 11.0% of total employment.
Who counts as self-employed in the statistics?
Statistics Canada counts active owners of a business, incorporated or not, with or without employees, as well as self-employed people without a business and unpaid family workers. The industry is assigned based on the main job.
Sources
- Employment by class of worker, annual (x 1,000), table 14-10-0027-01, Statistics Canada
- Travail autonome — Vitrine statistique sur l'égalité entre les femmes et les hommes, Institut de la statistique du Québec (French)
- Travail autonome — Vitrine statistique sur les jeunes de 15 à 29 ans, Institut de la statistique du Québec (French)
- Déterminer le statut d'un travailleur (Determining a worker's status), Revenu Québec
- Immatriculer une personne physique exploitant une entreprise individuelle (Registering a sole proprietorship), Québec.ca